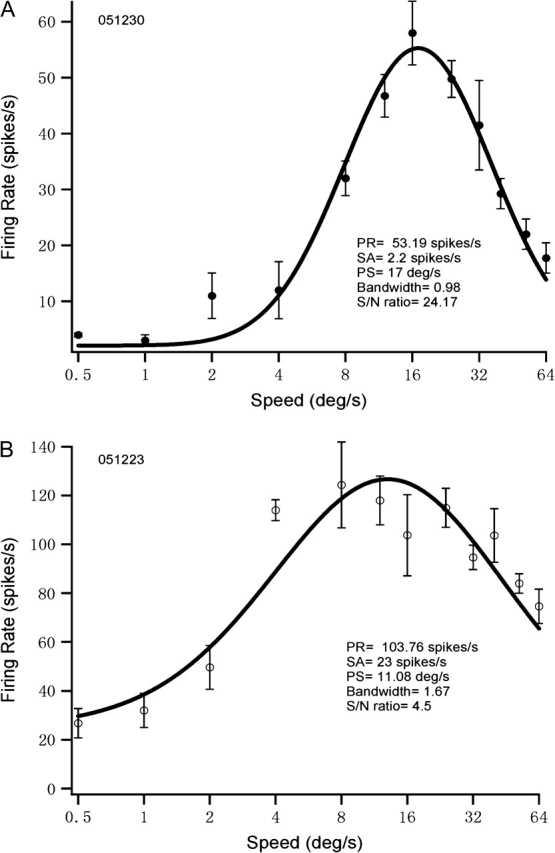
Figure 1.

Speed-tuning curves for 1 young monkey MT cell (A) and 1 old monkey MT cell (B) are shown. Horizontal axis is plotted logarithmically. The responses to systematically varied speed were averaged. Error bars mean SEM. PR, SA, PS, and S/N represent peak response, spontaneous activity, preferred speed, and signal-to-noise ratio, respectively.
