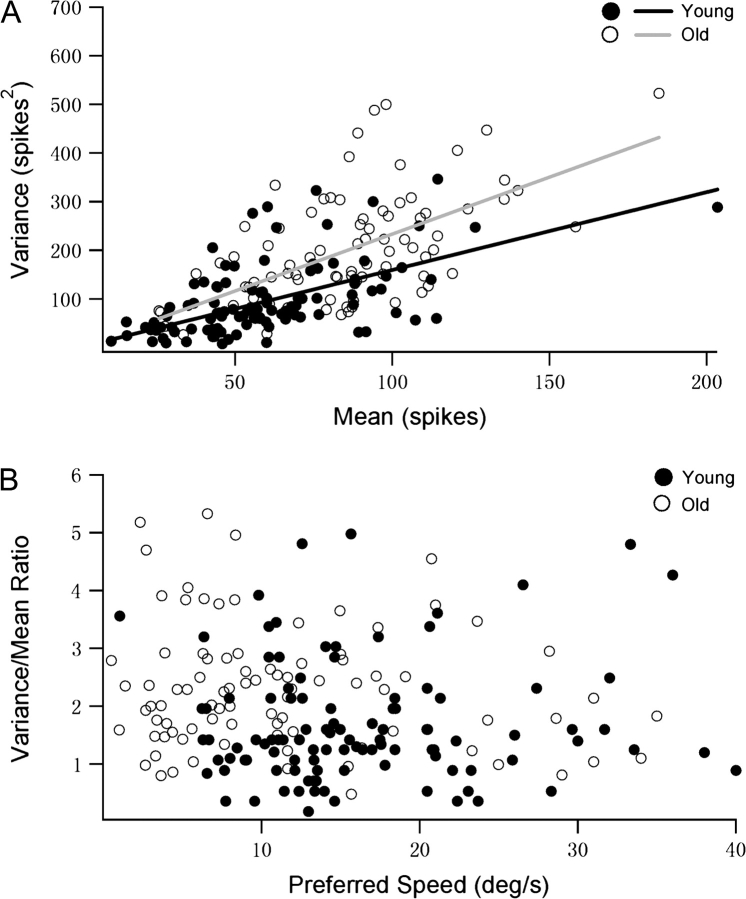
Figure 6.
Variability of MT neurons in young and old macaque monkeys studied using random-dot patterns. (A) Response variance is plotted against mean response. Data collected from 107 neurons in young monkeys and 88 in old monkeys. (B) The variance/mean ratio for each MT neurons in young and old animals is plotted as a function of its preferred speed.

