
Figure 1.
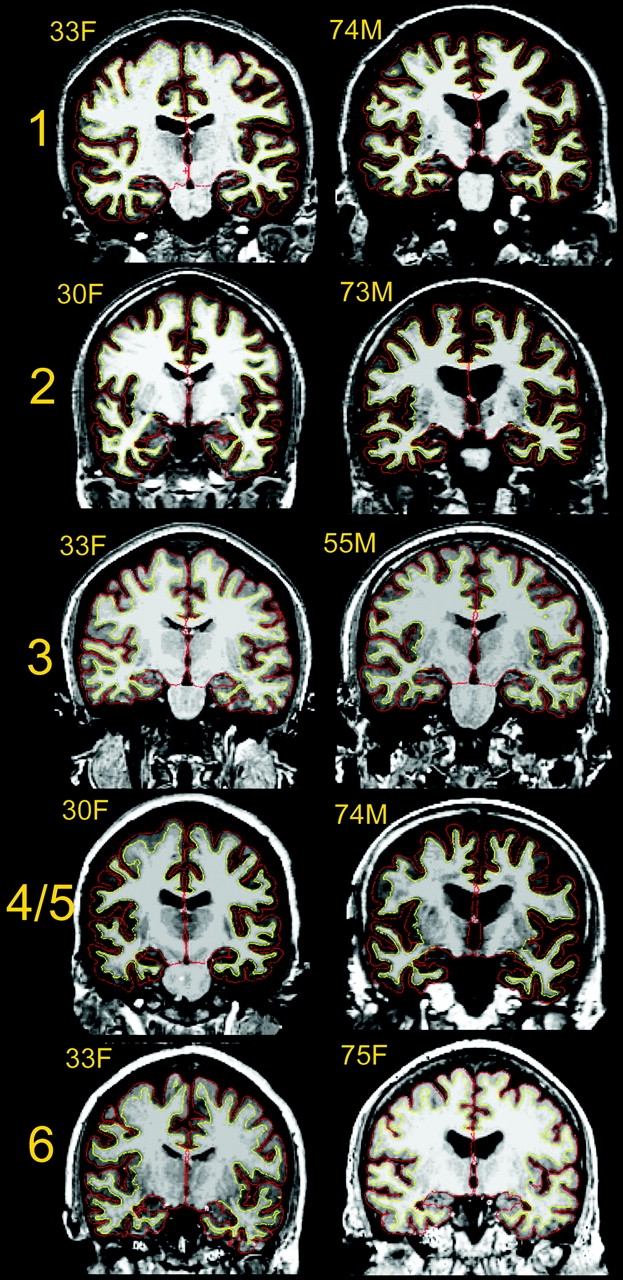
Example scans from each sample. Scans representative of image quality of 1 young and 1 elderly participant from each of the samples are shown (because sample 4 and 5 are from the same scanner, only examples from sample 4 are shown. All scans are converted from their native format to Freesurfer format. Samples 1, 2, and 4 are taken from Siemens scanners, and 2–4 acquisitions were averaged from each participant to yield high contrast and signal to noise ratio. Sample 2 and 6 are from GE scanners (Signa), with 1 acquisition. The cortex–CSF boundary (red) and the gray–white boundary (yellow) are indicated by the thin line. Anatomical differences between the scans from each sample are incidental.