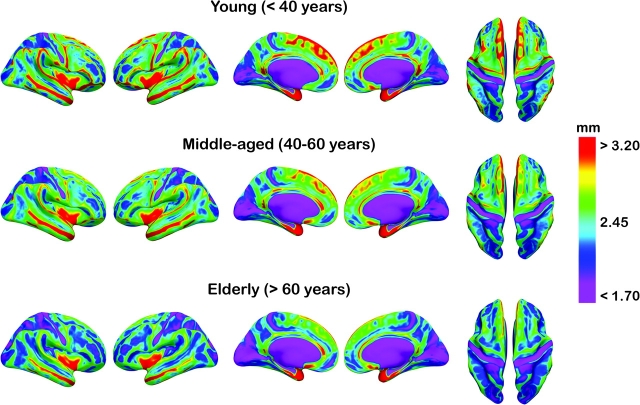
Figure 2.
Mean cortical thickness in 3 age groups. Mean thickness in each hemisphere for the age groups <40 years, 40–60 years, and >60 years are color coded and projected onto an inflated template brain for better visualization of effects buried in sulci. Note that the participants from all the samples are pooled together in each of the age groups, with no corrections for scanner or sample.

