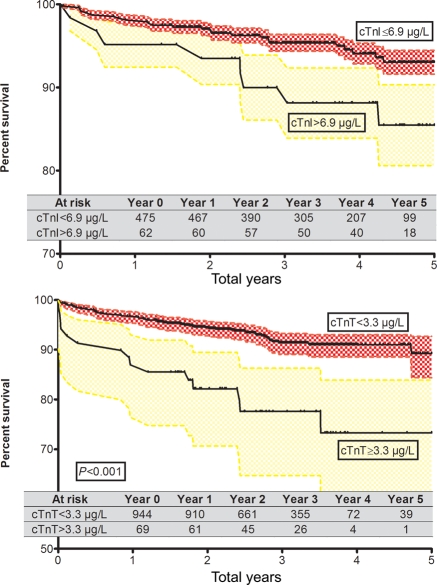
Figure 4.
Kaplan–Meier survival for troponin dichotomized at optimal ROC. Shown are unadjusted all-cause survival curves for troponin at respective cut-offs. The optimal dichotomization point was determined in a Cox proportional hazard model for mortality by examining the troponin level which resulted in maximal improvement in model performance shown by the negative two log-likelihood ratio. Additionally, area under the curve (AUC) was examined in receiver operating characteristic (ROC) curves in a multivariable model for mortality to confirm the optimal cut-point selection. cTnT and cTnI indicate cardiac troponin T and I.

