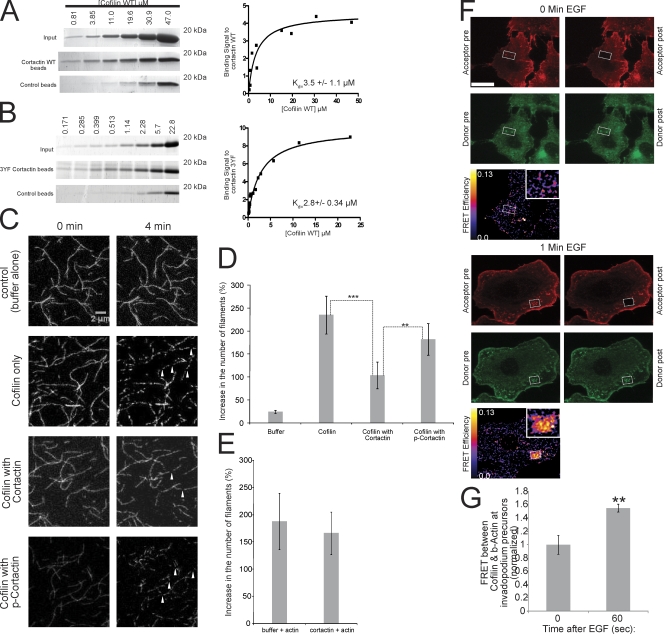
Figure 6.
Cortactin directly binds to cofilin and inhibits cofilin's severing activity, and this inhibition is relieved when cortactin is tyrosine phosphorylated. (A and B) (left) Coomassie-stained gels and (right) quantification of the binding signal of cofilin to (A) WT cortactin (Kd = 3.5 ± 1.1 μM) or (B) 3YF cortactin (Kd = 2.8 ± 0.34 μM) from in vitro pull-down assays at increasing concentrations of cofilin. Number of data points for Kd calculation: WT = 12, 3YF = 16. (C) Representative images showing cofilin's severing activity with cofilin alone, in the presence of cortactin, or phospho-cortactin. Arrowheads show actin filaments severed by cofilin. Bar, 2 μm. (D) Quantification of the percent increase in the number of actin filaments after incubation with cofilin alone, cofilin with cortactin, or cofilin with phospho-cortactin. P > 0.05 for cofilin alone vs. cofilin with p-cortactin. (E) Quantification of the percent increase in the number of actin filaments after preincubation of actin filaments with cortactin or buffer alone as described in Materials and methods. (F) Representative cofilin/β-actin FRET efficiency images of cells stimulated with EGF for 0 (top) and 1 min (bottom). Red = β-actin, green = cofilin. Bar, 10 μm. (G) Quantification of FRET between cofilin and β-actin at invadopodium precursors in response to EGF normalized to time 0 (FRET efficiency at 0 s = 4.2% ± 0.6). n = number of invadopodium precursors: 0 (34), 60 (46); three independent experiments.

