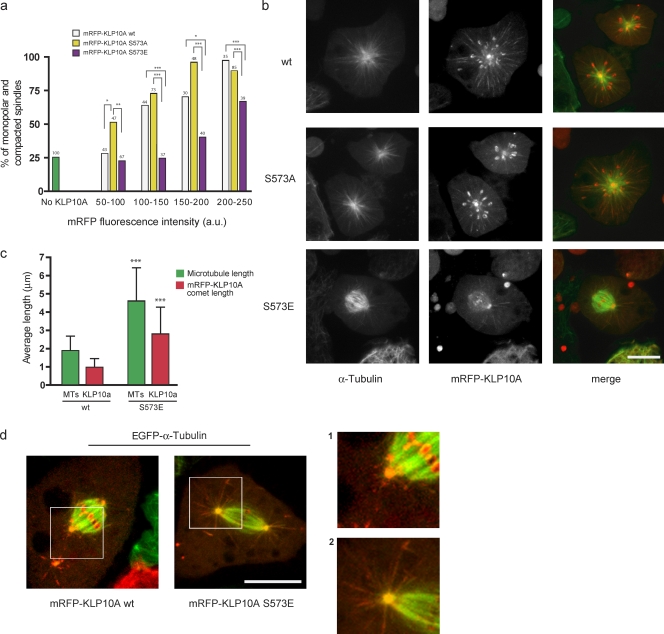
Figure 3.
KLP10A S573 phosphomimetic and nonphosphorylatable mutants alter MT dynamics in mitosis. (a) Percentage of KLP10A wt–, S573A–, or S573E–expressing mitotic cells with collapsed or monopolar spindles. Control cells were not transfected with any KLP10A construct (green bar). Cells expressing similar levels of the different transgenic KLP10A constructs are grouped together for comparative analysis. Numbers at tops of bars indicate n. Fig. S1 b shows the distributions of mRFP expression levels in the analyzed cells. (b) Representative confocal images of mitotic figures observed in the presence of similar amounts of mRFP-KLP10A wt, S573A, and S573E. (c) Mean astral MT lengths and mRFP-KLP10A comet lengths in mitotic cells expressing mRFP-KLP10A wt (n = 9 for 40.17 MTs) or S573E (n = 9 for 88.71 comets). (d) Images showing astral MTs of spindles from cells expressing either the wt or S573E protein. Magnified views of the boxed regions are shown on the right. *, P < 0.05; **, P < 0.01; ***, P < 0.001. Error bars indicate SD. Bars, 5 µm.

