Figure 5.
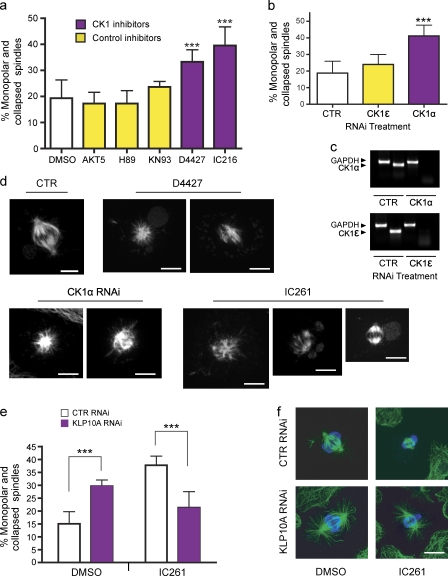
Regulation of KLP10A by CK1α. (a) The concentrations of kinase inhibitors applied to medium were chosen according to their reported Ki values (Table S1). DMSO, n = 6 (600); AKT5, n = 4 (400); H89, n = 4 (400); KN93, n = 3 (300); D4427, n = 4 (400); and IC216, n = 4 (400); with numbers in parentheses indicating the total number of cells analyzed. (b) RNAi treatment was performed to deplete the CK1α and -ϵ isoforms in S2 cells. Only CK1α RNAi significantly increased the percentage of monopolar spindles. Control (CTR), n = 4 (400); CK1ϵ, n = 6 (600); and CK1α, n = 8 (800). (c) Semiquantitative PCR showing the efficacy of RNAi. The housekeeping gene, GAPDH, was used as a control. (d) Gallery of mitotic phenotypes obtained after inhibition of CK1. (e) Depletion of KLP10A by RNAi rescues the increase in monopolar/collapsed spindles caused by CK1 inhibition. After RNAi, S2 cells were incubated in the presence of 8 µM IC261 for 3 h and processed for immunostaining with antitubulin and antiphospho-histone antibodies. DMSO control RNAi, n = 2 (400); DMSO 10A RNAi, n = 3 (600); IC261 control RNAi, n = 2 (400); and IC261 10A RNAi, n = 3 (600). (f) Representative images of mitotic spindles obtained from the rescue experiment shown in e. Green, antitubulin; blue, antiphospho-histone. ***, P < 0.001. Error bars indicate SD. Bars, 5 µm.

