Figure 2.
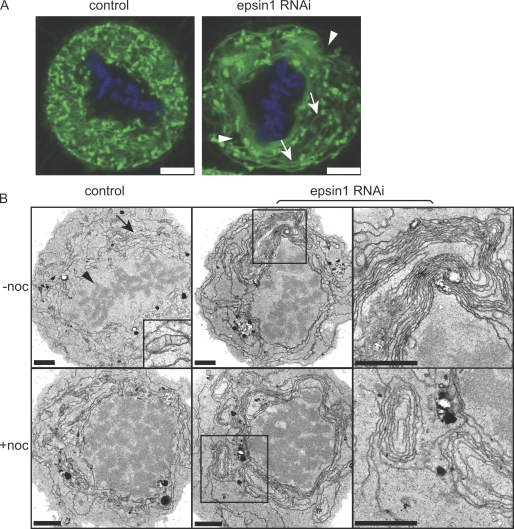
Effects of epsin1 reduction on membrane organization in mitotic HeLa cells. (A) Control or epsin1-depleted cells were labeled with DiOC6(3) and Hoechst 33258 to visualize membranes and chromosomes, respectively. Confocal images of mitotic cells at one z section are shown. Epsin1 depletion caused aberrant membrane morphologies such as areas without fluorescent signal (arrowheads) or long-running membrane tubules or sheets (arrows), which were not seen in normal control cells. (B) EM images of control siRNA– or epsin1 siRNA2–treated cells are shown. Control mitotic cells have even membrane structures (arrow) surrounding the condensed chromosomes (arrowhead). An area containing mitochondria is enlarged in the inset (top left). Abnormal membrane structures such as whorls with multiple layers of membranes are present in epsin1 siRNA2–treated mitotic cells. Cells were analyzed 3 d after RNAi treatment with or without nocodazole arrest (+noc). Similar results were obtained with an additional epsin1 siRNA oligonucleotide (siRNA1). Boxed areas in the middle panels are enlarged in the right panels. Bars: (A) 5 μm; (B) 2 μm.

