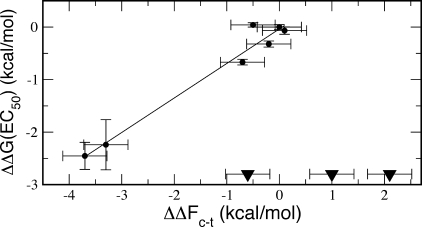
Figure 6.
Correlation between cis−trans free energy differences from the metadynamics simulations and from experimental data (EC50s) on the activation of 5-HT3R;(15) the data for the mutants corresponding to functional channels are indicated as circles; those corresponding to nonfunctional channels (hence with no available EC50), with triangles.

