
Fig. 1.
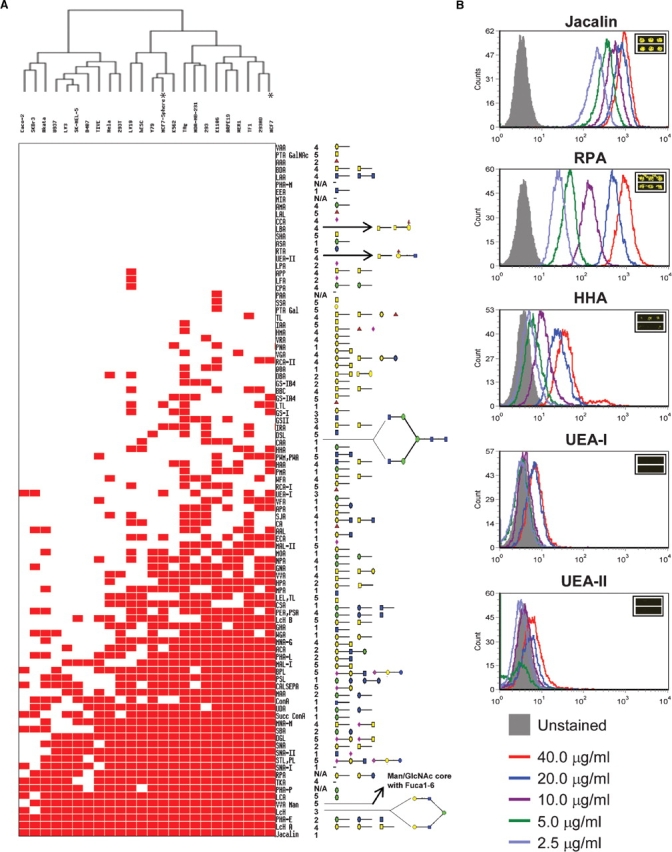
Binary cell binding signature. (A) Thumbnail overview of the one-way hierarchical cluster of 24 human cell lines (rows) and 94 lectins (columns). The corresponding carbohydrate specificities were depicted to the right as cartoons on the basis of information provided from five different sources. (B) Validation of cell-lectin binding by FACS. Cells were gated on FCS versus side scatter and all analysis was done on viable gated cells. Histogram overlays showing lectin staining of several indicated lectins at varying concentrations bound to K562 cells for Jacalin, RPA, HHA, UEA-I, and UEA-II which show a range of lectin binding from highly bound lectins (Jacalin), to moderately bound lectins (RPA and HHA), to non-binding lectins (UEA-I and UEA-II). Insets are the microarray images for the respective lectins. Glycan legend: Galactose ◯, GalNAc □, Glucose  , GlcNAc
  , Mannose
  , Fucose
  , Sialic acid
  . *MCF7 cells under normal and sphere culture conditions showing different lectin binding profiles used to demonstrate glycan signature-based biomarker discovery.