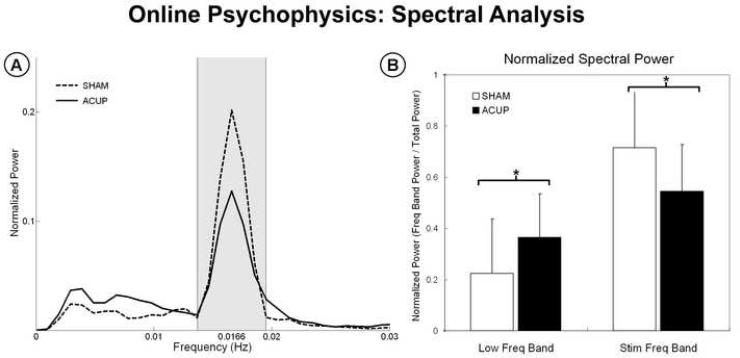
Figure 3.
Spectral analysis of online sensation ratings. (A) Average spectra for both ACUP and SHAM demonstrated a large peak in the stimulation frequency band (0.01366-0.01966Hz?). (B) SHAM demonstrated greater power in the stimulation frequency band, while ACUP demonstrated greater power in a lower frequency band, below the stimulation band. n.b error bars in (B) represent standard deviation. * p < 0.05

