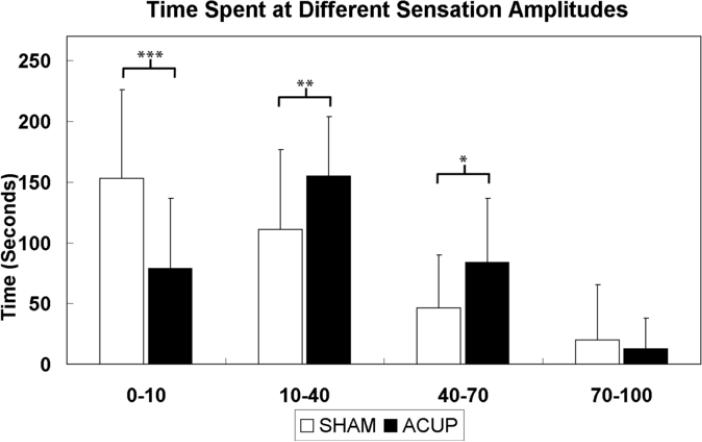
Figure 4.
Cognitive load was inferred from the amount of time subjects spent rating different sensation intensities. For ACUP, subjects spent more of the scan run (330sec total) rating both low (10-40) and moderate (40-70) sensations than for SHAM. In turn, subjects experiencing SHAM spent more time rating minimal to no sensation (0-10). No difference was found for strong sensations. n.b. error bars represent standard deviation. *** p < 0.001, ** p < 0.005, * p < 0.05

