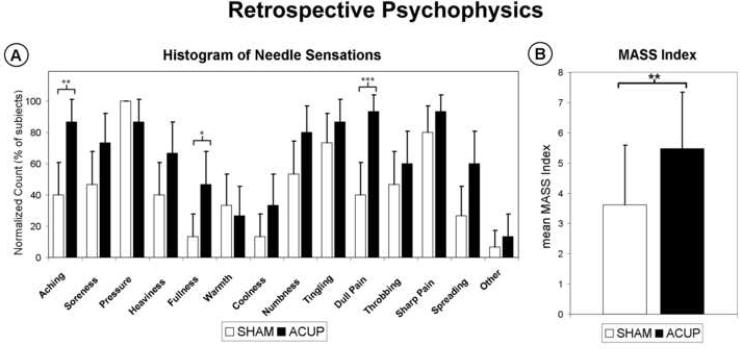
Figure 5.
Retrospective psychophysical analysis using the MASS scale. (A) Differences in the types of sensations elicited (expressed as a histogram) were found between ACUP and Sham. ACUP more frequently induced “aching”, “fullness”, and “dull pain”. (B) MASS index, a summary measure of sensation intensity, was greater for ACUP compared to SHAM. n.b. Error bars in (A) represent a 90% confidence interval for binomial distribution. Sensations on the abscissa are in the order presented to the subjects. Error bars in (B) represent standard deviation. * p < 0.05, ** p < 0.01, *** p < 0.005.

