
Table 1.
IC50 values.a
| compound | structure | IC50 µM |
|---|---|---|
| 10 | 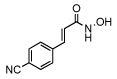 |
61 ± 4 |
| 11 | 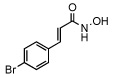 |
40 ± 5 |
| 12 | 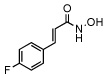 |
54 ± 8 |
| 13 | 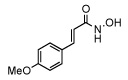 |
79 ± 8 |
| 14 | 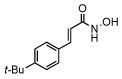 |
>100 |
| 15 | 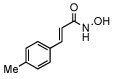 |
87 ± 6 |
| 16 | 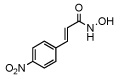 |
72 ± 5 |
| 17 | 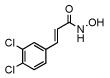 |
75 ± 4 |
| 18 | 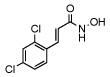 |
0.41 ± 0.03 |
| 19 | 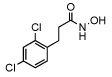 |
3.1 ± 0.9 |
| 20 | 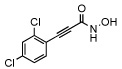 |
73 ± 5 |
| 21 |  |
>100 |
a
Assays were conducted at various inhibitor concentrations at 22.5 °C, pH 7.4 in 40 mM HEPES 0.01% (W/V) Tween® 20, 5 µM SNAPtide substrate and 200 nM enzyme.