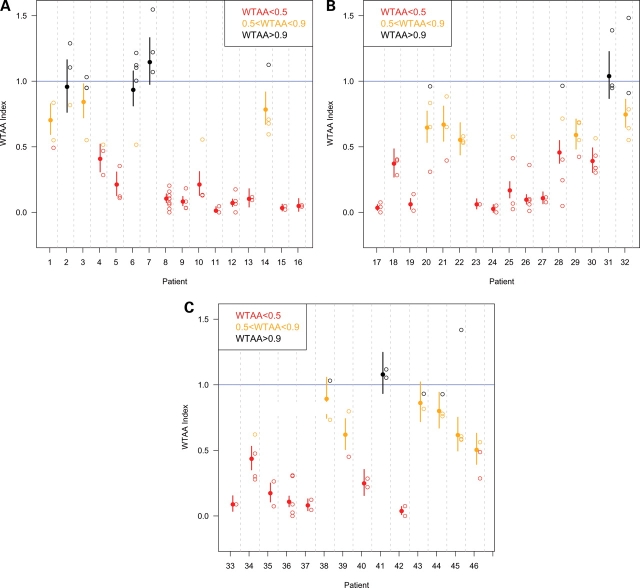
Figure 3.
(A–C) Relative strengths of the 46 variant SIX3 alleles tested (see Table 1 for clinical details). Open circles represent the individual experiments. The Y-axis represents normalized outcomes, as explained in Material and Methods. Filled circles represent the average outcome and the vertical bars represent the 95% confidence interval, calculated by simulation using a multinomial model. Raw values are reported in Supplementary Material, Table S1. Alleles are presented 5′–3′. (A) Alleles 1–16 (see Table 1 and Supplementary Material, Table S1 for clinical details), spanning the N-terminus, the poly-glycine domain and N-terminal half of the Six domain. (B) Alleles 17–32, spanning the C-terminal half of the SIX domain and N-terminal half of the homeodomain. (C) Alleles 33–46, spanning the C-terminal half of the homeodomain, the C-terminal motifs and the C-terminus. Data points are color-coded to represent allele strengths in the overexpression assay, as also indicated in Table 1 and Fig. 4: color: red = <50% activity, orange = 50–90% activity and black >90% activity.

