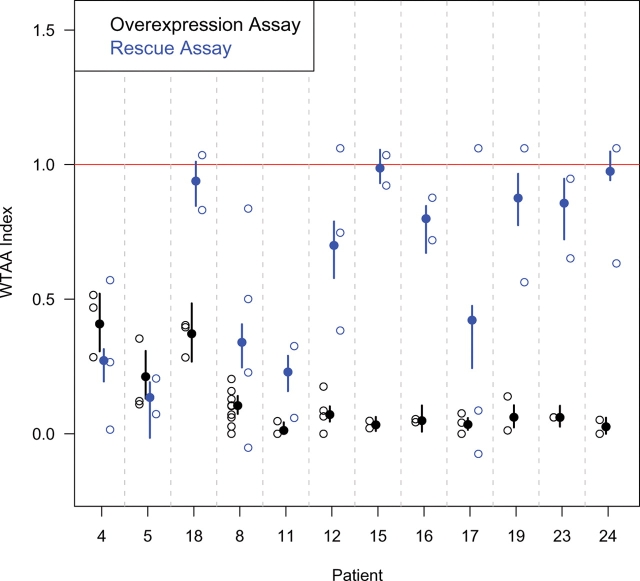
Figure 5.
Side-by-side comparison of relative signaling strengths for various predicted SIX3 truncation alleles in the two biosensor assays. Open circles represent individual experiments. The Y-axis represents the normalized outcomes, as explained in Material and Methods and Supplementary Material, Table S2. Filled circles represent the average outcome and the vertical bars represent the 95% confidence interval, calculated by simulation using a multinomial model. The two most N-terminal truncations (patients 8 and 11), as well as point mutations in the first eh1-domain (patients 4 and 5), cause loss of function in both assays; however, downstream truncations in which the N-terminal 129 amino acids are intact generally retained activity in the rescue assay (patients 12, 15, 16, 19, 23 and 24, but not 17), as did a point mutation in the second eh1 domain (patient 18).

