
Figure 3.
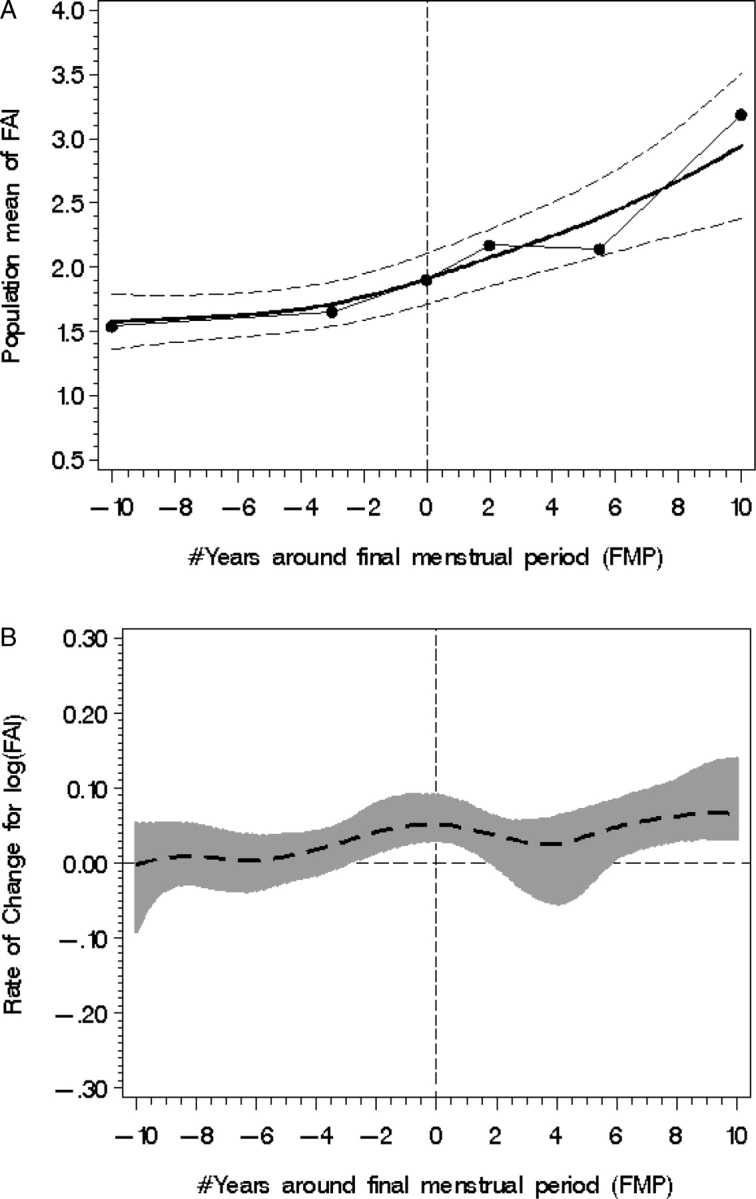
Population mean FAI (A) with fitted model (smooth line), piecewise line (dotted line) and 95% CI from 10 years before to 10 years after the FMP, designated with zero year. (B) FAI rate of change (95% CI shown with shading); statistical significance occurs when the 95% CI does not overlap with the line of no change (occurring between −3 years < FMP < +2 and >6 years FMP).