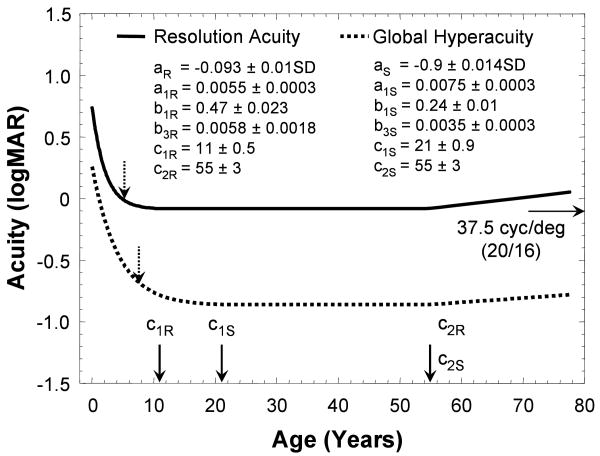
Figure 5.
The fitting results for resolution acuity and global hyperacuity. The standard deviation (SD) for each parameter gives the range when fitting error is within 1% of minimum root-mean-square error. The dashed vertical arrows indicate the years when the developments of resolution acuity and global hyperacuity reach 95% upper limit of the adult's range.

