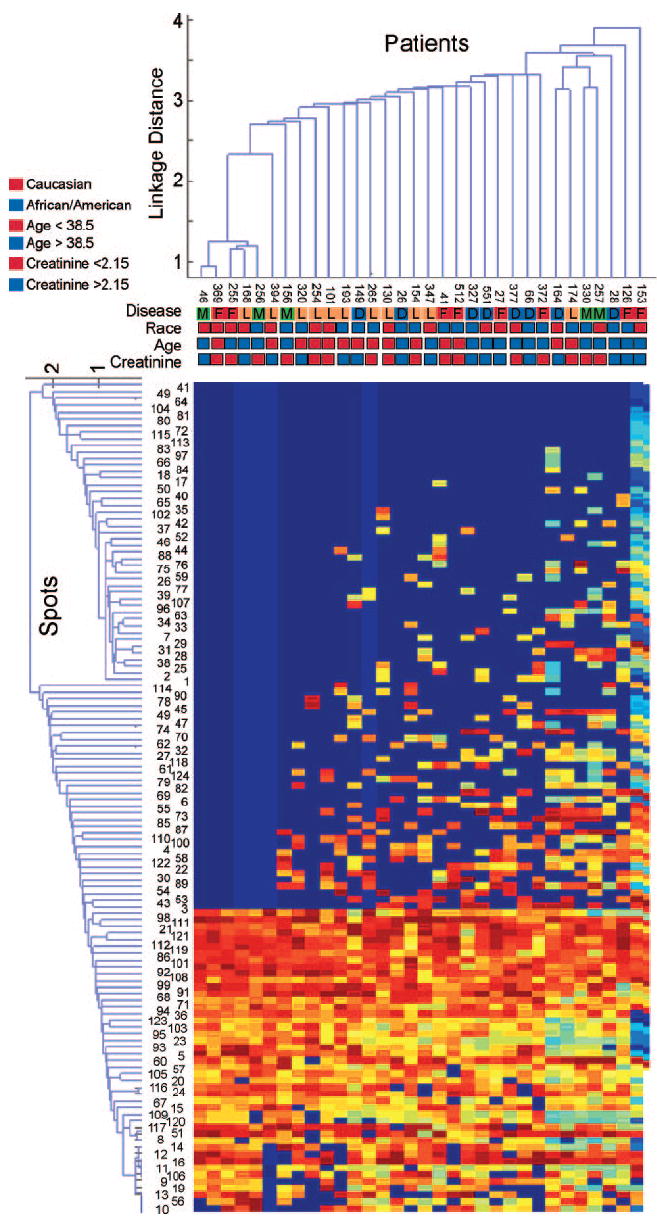
Figure 2.

Unsupervised cluster analysis of protein expression in patients with glomerular diseases. Patterns of clustering did not occur on the basis of collection order, disease, race, age, or serum creatinine of patients. The colored boxes represent disease, race, age, and serum creatinine values. The creatinine values are color coded for those above or below the median value. Numbers in the line above the disease represent the sequential order in which the samples were collected.
