
Figure 4.
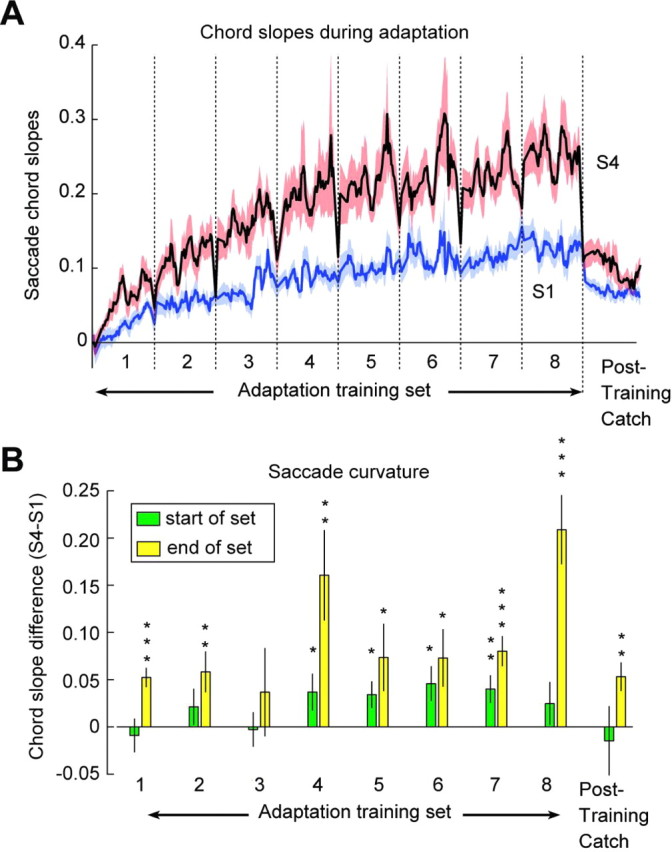
The multiple timescales of adaptation. A, Moving average of the time course of S1 and S4 during adaptation (480 trials) and posttraining catch trials (60 trials). To highlight the rapid changes at the start of each set, we used a variable bin width (bw): bw = 2 trials for the first two trials in each set, bw = 4 for the next four trials, and bw = 6 for the rest of the set. Red and blue shaded areas represent SEM (n = 11). B, Curvature (chord slope S4 − S1) at the start and end of each set. The bin size is two saccades. Saccades that initiate each set have generally smaller curvature than saccades that complete the set. Eight of nine sets end with saccades that are curved (*p < 0.05; **p < 0.01; ***p < 0.001). Error bars represent SEM (n = 11).