Figure 2.
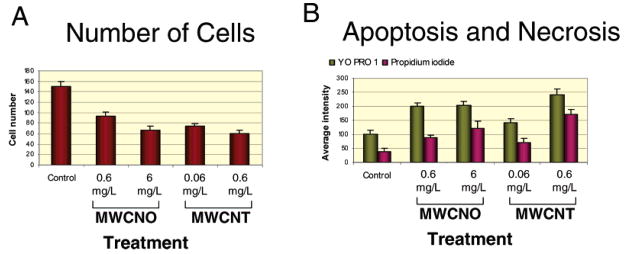
Cell viability measurements after treatment with carbon nanomaterials at cytotoxic doses. Cells were plated on 96-well plates, treated for 48 h, and then stained with Hoechst (nucleus stain for cell number indicator), YO-PRO 1 (apoptosis indicator) and PI (necrosis indicator). Plates were transported to KineticScan (KSR, Cellomics, Pittsburgh, PA) for image collection, then automated analysis was performed on the collected images. (A) The number of skin fibroblast cells per well 48 h after mock treatment with ethanol or treatment with either MWCNOs (NO) or nanotubes (NT). The numbers of low doses (0.6 μg/mL for MWCNO and 0.06 μg/mL for MWCNT) and high doses (6 μg/mL for MWCNO and 0.6 μg/mL for MWCNT) represent the nanomaterial concentration used for treatment. Bars represent the mean of cell numbers from 10 imaged view fields in 10 treated wells, and error bars represent a 95% confidence interval. Each nuclei imaged by the KSR was identified with the Cell Health Profiling software in the blue channel by Hoechst staining. (B) YO-PRO 1 is visualized in the green channel and PI is visualized in the red channel, where measurement such as dye intensity and area can be made using the Cell Health Profiling algorithm. Average intensity of YO-PRO 1 intensity and PI intensity of mock treated and treated skin fibroblasts at 48 h. The YO-PRO 1 intensity is proportional to apoptosis and the PI intensity correlates to necrosis. Bars represent the mean of cell numbers from eight treated wells and the error bars represent a 95% confidence interval. Data for lung fibroblast treated under the same condition are presented in Supporting Information Figure S1.

