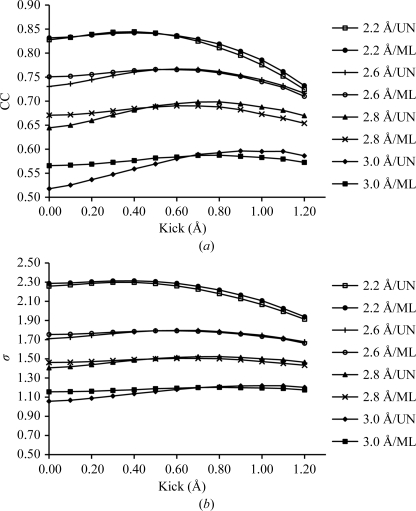
Figure 2.
Map improvement as a function of kick size and model quality. The UN AK and ML AK maps calculated from four molecular models corresponding to four different stages (see Table 2 ▶) in the determination of the crystal structure of cathepsin H. For each model UN AK and ML AK maps were calculated with kick sizes from 0.1 to 1.2 Å from 100 kick maps. Zero kick size corresponds to the UN and ML maps, respectively. In (a) CCs between the final F model map and UN AK and AK maps are shown. (b) shows the average density of the final model atoms in each particular map.

