
Figure 8.
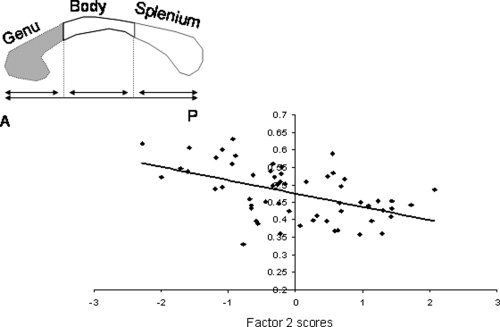
Average fractional anisotropy values for the genu, shown as the shaded area of the corpus callosum, are plotted versus factor scores for Factor 2 in senescing subjects (age 30–90)
Official websites use .gov
A
.gov website belongs to an official
government organization in the United States.
Secure .gov websites use HTTPS
A lock (
) or https:// means you've safely
connected to the .gov website. Share sensitive
information only on official, secure websites.
Average fractional anisotropy values for the genu, shown as the shaded area of the corpus callosum, are plotted versus factor scores for Factor 2 in senescing subjects (age 30–90)