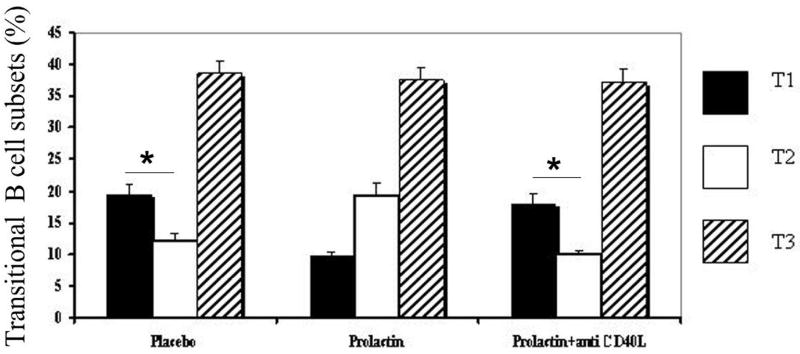
Figure 1. Flowcytometric analysis of the transitional B cell subsets.
In mice treated with placebo (n=5) or prolactin+anti-CD40L antibody (n=5), the percentage of T1 B cells (CD19+CD93+IgM+CD23-) was significantly higher than the T2 B cells (CD19+CD93+IgM+CD23+) (p=0.0003 and p=0.0004, respectively), but that was not the case with prolactin-treated mice (n=5) in which T1/T2 B cell ratio was <1. No significant difference was found in the size of the T3 (CD19+CD93+IgMlowCD23+) subset among the mice treated with placebo, prolactin or prolactin+anti-CD40L antibody.

