
Figure 1.
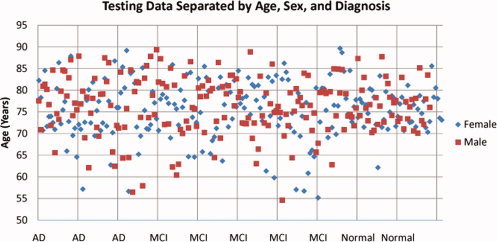
A visual representation of the testing data set. This plot shows a breakdown of all subjects by age, sex, and diagnosis. The points have been spread out along the horizontal axis to make it easier to see members of each diagnostic group. [Color figure can be viewed in the online issue, which is available at www.interscience.wiley.com.]