
Figure 12.
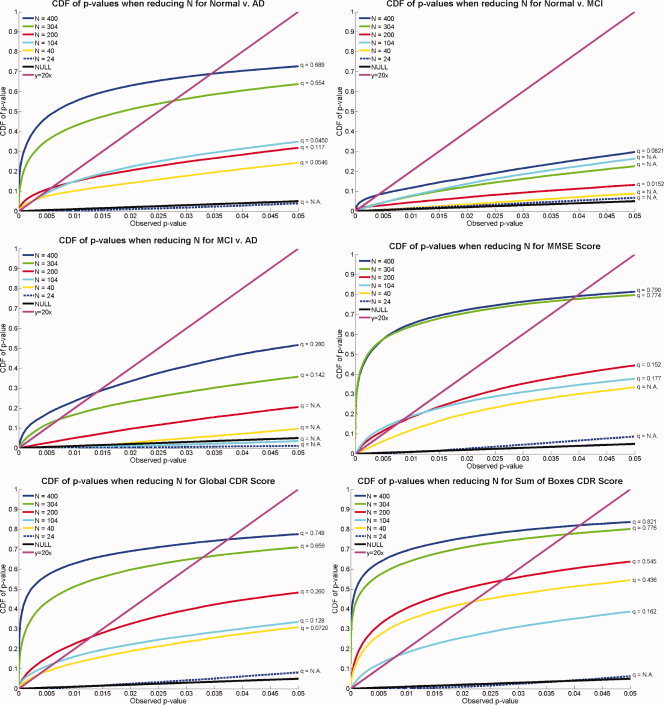
Effects of varying the sample size: CDFs of P‐values measuring the effect sizes for correlations between hippocampal atrophy and different covariates, as the sample size, N, decreases. In general, greater effect sizes are shown by CDFs with the most rapid upswings from the origin. In almost all cases, the results based on smaller sample sizes show lower effect sizes than those computed from larger samples. There is not a monotonically increasing relation between sample size and the height of the CDF computed from the sample, as each sample is the result of random sampling from a population. In general however, as N decreases, the power to detect a given effect is less. The minimal effective sample sizes differ for different effects. [Color figure can be viewed in the online issue, which is available at www.interscience.wiley.com.]