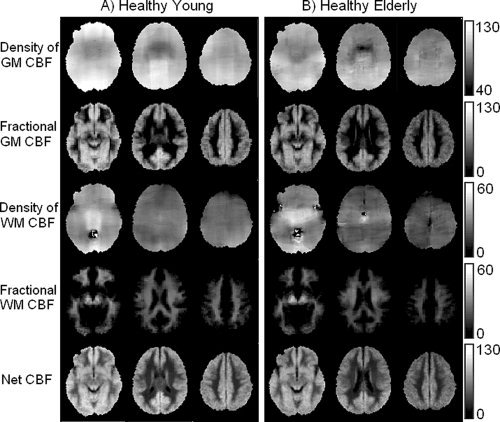
Figure 1.

Group averaged CBF images from HY (A) and HE (B). 1st and 3rd rows show tissue specific images, f GM and f WM, respectively. Fractional CBF images, f and f for are shown in 2nd and 4th rows, respectively; the last row shows f NET. Slices were chosen to represent lower, middle, and upper areas of the brain (MNI z‐coordinates: 21, 37, and 41). Units in the bars are in mL/[100 g min−1]. Note good uniformity of the image signal for GM and WM flow densities (1st and 3rd rows).
