
Figure 4.
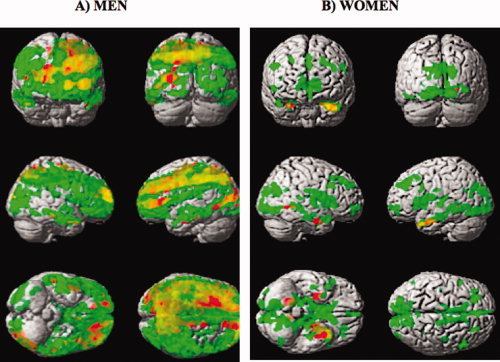
Voxelwise SPM{T} map for the (HY−HE) contrast (corrected at the cluster level of 50 voxels, T > 3.84) overlaid on a surface rendering of the brain for females (A) and males (B) for f GM (red) and f NET (green). The overlap of the areas where both f GM and f NET were statistically lower in HE are shown in orange.