
Figure 2.
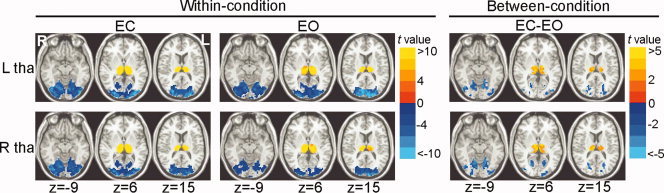
Within‐condition and between‐condition functional connectivity maps of the whole thalamus. Within‐condition [eyes closed (EC) and eyes open (EO)] functional connectivity maps of the whole thalamus were shown on the left part. Between‐condition differences of the functional connectivity maps between EC and EO were shown on the right part. Within‐condition and between‐condition maps of left thalamus were shown on the top row, and those of the right thalamus were shown on the bottom row. ‘L’ denotes the left hemisphere of the brain and ‘R’ denotes the right hemisphere. ‘tha’ denotes thalamus. The numbers below the images refer to the z coordinates in the Talairach and Tournoux space. Statistical threshold was set at a significance level of P < 0.05 by combining individual voxel P < 0.05 with a minimum cluster size of 810 mm3 using a Monte Carlo simulation algorithm.