
Figure 4.
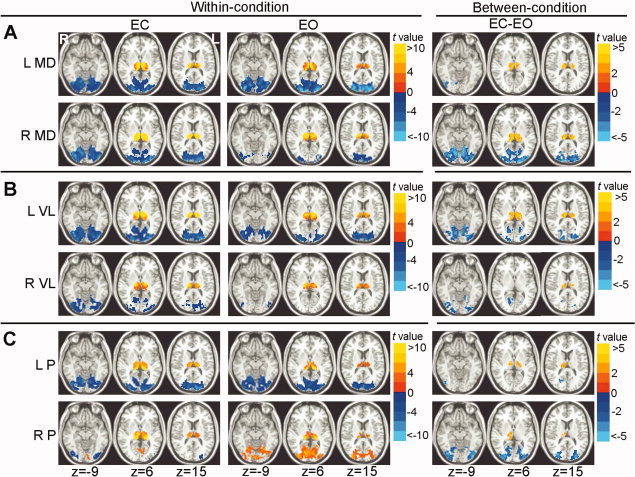
Within‐condition and between‐condition functional connectivity maps of the six thalamic nuclei. Within‐condition (EC and EO) functional connectivity maps of the mediodorsal (MD, Fig. 4A), ventrolateral (VL, Fig. 4B) and pulvinar (P, Fig. 4C) nuclei of thalamus were shown on the left part. Between‐condition differences of the functional connectivity maps between EC and EO were shown on the right part. Top rows: within‐condition and between‐condition maps of left seeds, and bottom rows: within‐condition and between‐condition maps of right seeds. ‘L’ denotes the left hemisphere of the brain and ‘R’ denotes the right hemisphere. The numbers below the images refer to the z coordinates in the Talairach and Tournoux space. Statistical threshold was set at a significance level of P < 0.05 by combining individual voxel P < 0.05 with a minimum cluster size of 810 mm3 using a Monte Carlo simulation algorithm. It should be noted that the between‐condition difference maps of left MD, left P, and right VL nuclei were corrected by combining individual voxel P < 0.05 with a minimum cluster size of 405 mm3 due to the less significant results.