
Figure 5.
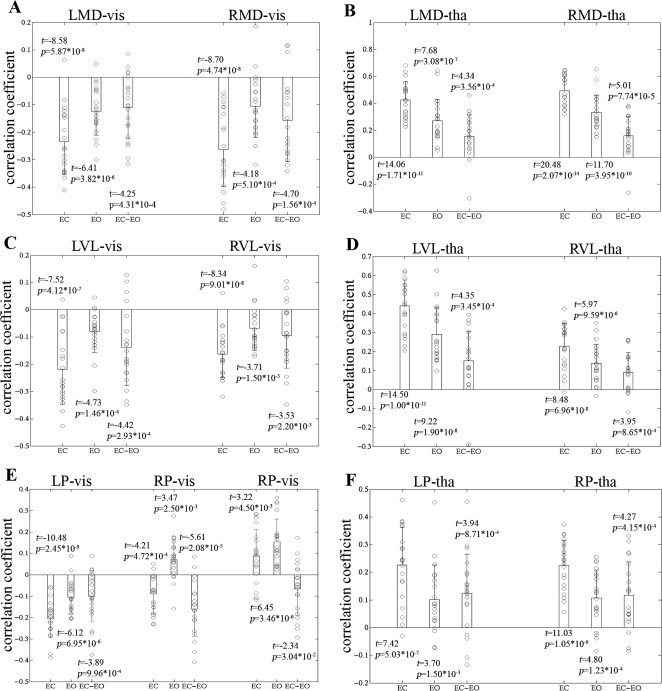
Average correlation coefficients between the thalamic nuclei and the visual cortex, and between the thalamic nuclei and the thalamus. (A) Within‐ and between‐condition connectivity values between the MD and visual cortex. (B) Within‐ and between‐condition connectivity values between the MD and the thalamus. (C) Within‐ and between‐condition connectivity values between the VL and visual cortex. (D) Within‐ and between‐condition connectivity values between the VL and the thalamus. (E) Within‐ and between‐condition connectivity values between the P and visual cortex. (F) Within‐ and between‐condition connectivity values between the P and the thalamus. For other details, see Figure 3.