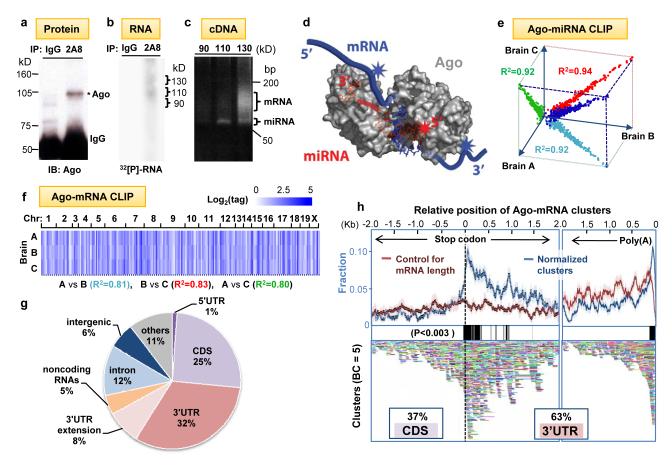
Fig. 1. Argonaute HITS-CLIP.
(a) Immunoblot (IB) analysis of Ago immunoprecipitates (IP) from P13 mouse neocortex using pre-immune IgG as a control or anti-Ago monoclonal antibody 2A8 were blotted with 7G1-1* antibody (Supplementary Methods). (b) Autoradiogram of 32P-labeled RNA crosslinked to mouse brain Ago purified by IP. RNA-protein complexes of ∼110 kD and ∼ 130 kD are seen with 2A8 but not control IP. (c) PCR products amplified after linker (36 nt) ligation to RNA products excised from (b). Products from the 110 kD RNA-protein complex were ∼22 nt miRNAs, and those from 130 kD complexes were predominantly mRNAs. (d) Illustration showing proposed interpretation of data in (c). Ago (drawn based on structure 3F73 in PDB)31 binds in a ternary complex to both miRNA and mRNA, with sufficiently close contacts to allow UV-crosslinking to either RNA; mRNA tags will be in the immediate vicinity of miRNA binding sites. (e-f) Reproducibility of all Ago-miRNA tags (e; graphed as log2(normalized miRNA frequency) per brain) or all tags within Ago-mRNA clusters (f; see Supplementary Figs. 2-3). We estimated that sequencing depth was near saturation (Supplementary Fig. 16). (g) Location of reproducible Ago-mRNA tags (tags in clusters; BC≥2) in the genome. Annotations are from RefSeq; ”others” are unannotated EST transcripts, non-coding RNAs are from lincRNAs50 or FANTOM3. (h) Top panel: The position of robust Ago-mRNA clusters (BC = 5) in transcripts is plotted relative to the stop codon and 3′ end (presumptive poly(A) site, as indicated). Data is plotted as normalized density relative to transcript abundance for Ago-mRNA clusters (blue) or control clusters (red), (standard deviations are shown in light colors; see Supplementary Methods). Regions with significant enrichment relative to control are indicated with black bars (> 3 standard deviations; P<0.003). Cluster enrichment ∼1kb downstream from stop codon appears to be due to a large number of transcripts with ∼1kb 3′ UTRs (data not shown). Bottom panel: All individual clusters (BC=5) are shown (each is a different color).

