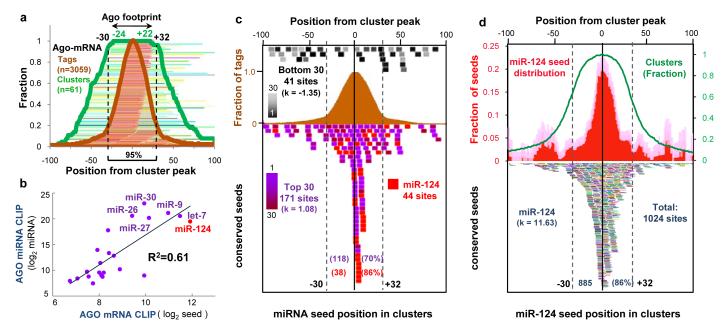
Fig. 2. Distribution of mRNA tags correlates with seed sequences of miRNAs from Ago CLIP.
(a) Ago-mRNA cluster width and peaks. The peaks of 61 robust clusters (BC = 5, peak height >30, with single peaks) were determined, and the position of tags (brown lines and fraction plotted as brown graph) and width of individual clusters (green lines and fraction plotted as green graph) are shown relative to the peaks (Supplementary Methods). The minimum region of overlap of all clusters (100%) was within -24 and +22 nt of cluster peaks, and ≥ 95% were within -30 and +32 nt, suggesting that the Ago footprint on mRNA spans 62 nt (or, more stringently, 46 nt). (b) A linear regression model was used to compare miRNA seed matches enriched in the stringent Ago footprint region with the frequency of miRNAs experimentally determined by Ago-miRNA HITS-CLIP (see also Supplementary Fig. 9). (c) The position of conserved core seed matches (position 2-7) from the top 30 Ago-bound miRNAs (independent of peak height; purple colors, including miR-124, red; or, bottom 30 miRNAs, expressed at extremely low levels in brain (Supplementary Fig. 2); black to gray colors) are plotted relative to the peak of 134 robust clusters (BC = 5, peak height >30). 118 of 171 seed matches are within the Ago 62 nt footprint (d) The position of conserved miR-124 seed matches (bottom panel; each is represented by a different color) were plotted relative to the peak position of all Ago-mRNA clusters (BC ≥ 2). Top panel; distribution of mir-124 seed matches (plotted relative to cluster peak, normalized to number of clusters; red graph); pale color indicates standard deviation. Excess kurtosis (k) indicates that seed sites are present in a sharp peak relative to a normal distribution.

