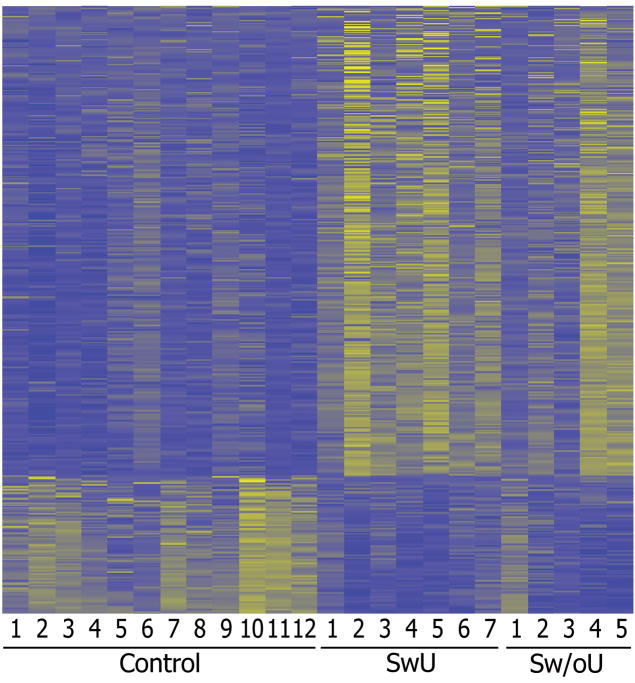
Figure 1.
Heat map differentially expressed transcripts between control and sarcoidosis patients (fold difference ≥ 2 and q ≤ 0.05).436 up- and 128 down-regulated in sarcoidosis groups. Refer to Supplementary Tables 1 and 2 for the complete gene lists.
SwU indicates sarcoidosis with uveitis and Sw/oU indicates sarcoidosis without uveitis.

