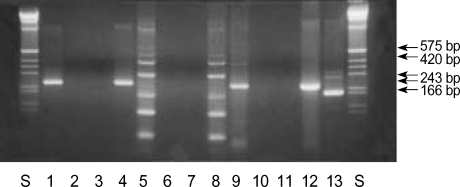
Fig. 1.
RT-PCR products following MDR1, MRP and LRP mRNA amplification. Lane S, size marker; lane 1, MDR1-positive cell line (band at 243 bp); lane 2, DW; lane 3, normal bone marrow; lane 4, MDR1-positive patient; lane 5, MRP-positive line (bands at 575 and 420 bp); lane 6, DW; lane 7, normal bone marrow; lane 8, s-positive patient; lane 9, LRP-positive cell line (band at 239 bp); lane 10, DW; lane 11, normal bone marrow; lane 12, LRP-positive patient; lane 13, β-actin (internal control, band at l66 bp). (DW=deionized water (negative control)).

