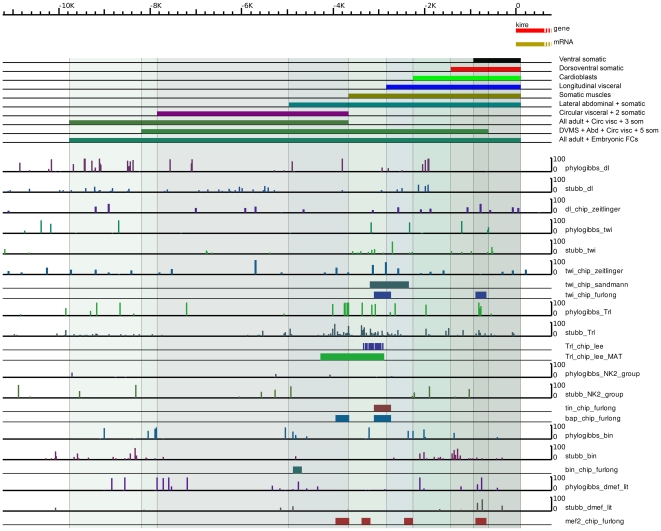
Figure 7. Comparison of PhyloGibbs-MP and Stubb predictions with ChIP data.
Comparison of PhyloGibbs-MP and Stubb predictions with ChIP data where available in the literature. Expression pattern of different duf enhancer reporter deletion constructs are also shown. The graphs “dl_chip_zeitlinger” and “twi_chip_zeitlinger” are plots of regions with reported MedianOfRatios >1.0 (logs of ratios are plotted) from the file MoRs.xls in the supporting data of Zeitlinger et al. While the original authors report no significant binding by the factors dorsal or twist in this region, these less significant predictions show correlation with our predicted binding sites, and in the case of twist, with ChIP data from elsewhere. The graph “twi_chip_sandmann” is from the supporting data of Sandmann et al. The graph “Trl_chip_Lee” is from Lee et al [47]. The graph “Trl_chip_Lee_MAT” is a reanalysis of the same data from Lee et al, using the program MAT [48], as described in the text. The graphs labelled “_furlong” are unpublished data from the Furlong Laboratory, EMBL, Heidelberg (E Furlong, personal communication). In most cases, ChIP predictions corroborate significant binding region predictions via our computational approaches. It should also be noted that most of these ChIP experiments were done over early development time courses, and therefore may not adequately reflect binding during myoblast development.

