
Table A9.
Cumulative diarrhoeal incidence
| Regression model | −2 log L | LRT | |
|---|---|---|---|
| 1 | 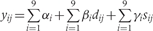 |
1549.432 | |
| 2 | 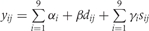 |
1558.672 | 2 vs 1; P = 0.409 |
| 3 | 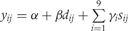 |
1649.180 | 3 vs 2; P < 0.001 |
| 4 | 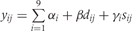 |
1585.169 | 4 vs 2; P < 0.001 |
Official websites use .gov
A
.gov website belongs to an official
government organization in the United States.
Secure .gov websites use HTTPS
A lock (
) or https:// means you've safely
connected to the .gov website. Share sensitive
information only on official, secure websites.
Cumulative diarrhoeal incidence
| Regression model | −2 log L | LRT | |
|---|---|---|---|
| 1 | |
1549.432 | |
| 2 | |
1558.672 | 2 vs 1; P = 0.409 |
| 3 | |
1649.180 | 3 vs 2; P < 0.001 |
| 4 | |
1585.169 | 4 vs 2; P < 0.001 |