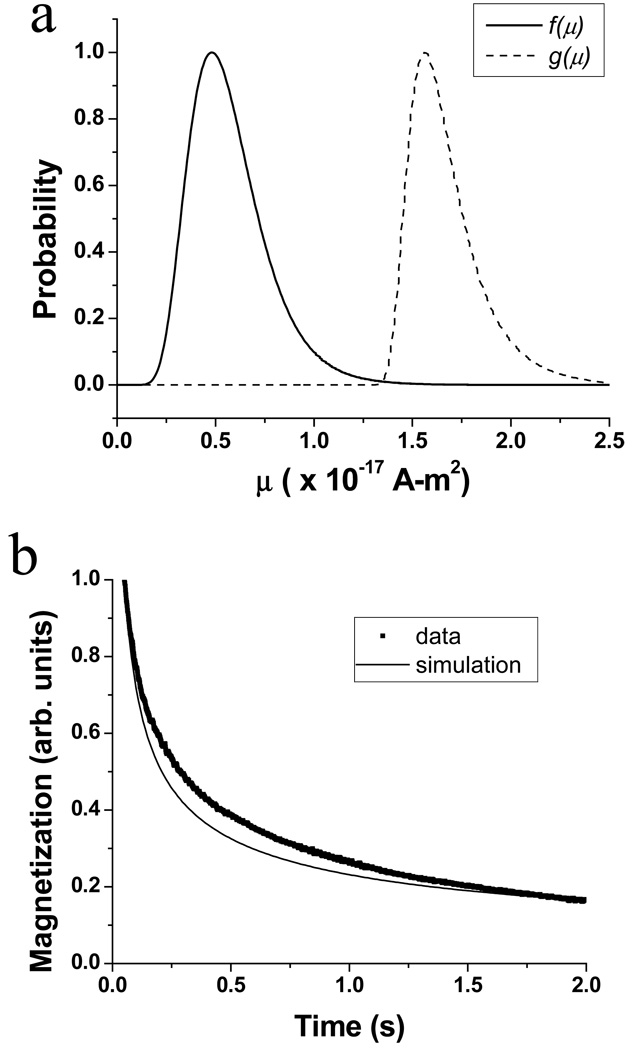
Fig. 6.
(a) Distribution of moments f(μ) (solid line) and distribution of observable magnetization g(μ) (dashed line) determined by MSM analysis of the relaxometry data in Fig. 3. (b) Relaxation curves determined experimentally (■) and by simulation (line) using Eq. 2 with the same parameters as in (a).

