
Figure 3.
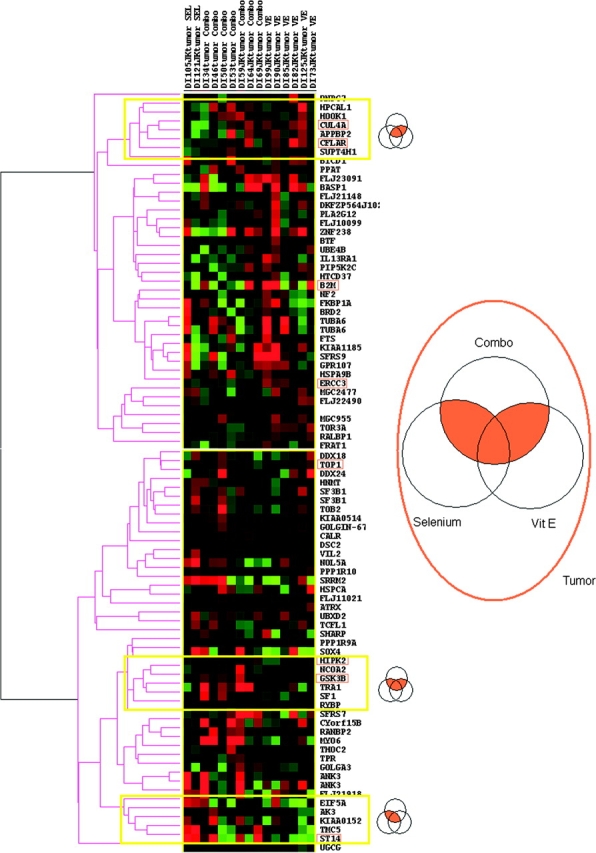
t Scores and unsupervised hierarchical clustering of differentially expressed genes found in combination treatment vs placebo and in at least one single treatment vs placebo group. Differentially expressed genes in both combination compared with placebo treatment and in at least one single treatment group compared with placebo treatment group are shown. In the heatmap, t scores of genes are shown in colors that reflect differences in gene expression levels of treatment (combination, selenium, or vitamin E) compared with placebo (green = decreased expression; red = increased expression). Representative clusters (genes differentially expressed in vitamin E and combination treatment, in all three treatments, and in selenium and combination treatment) are marked with yellow boxes and are presented in the associated Venn diagram. Validated genes (Figure 4) are boxed.