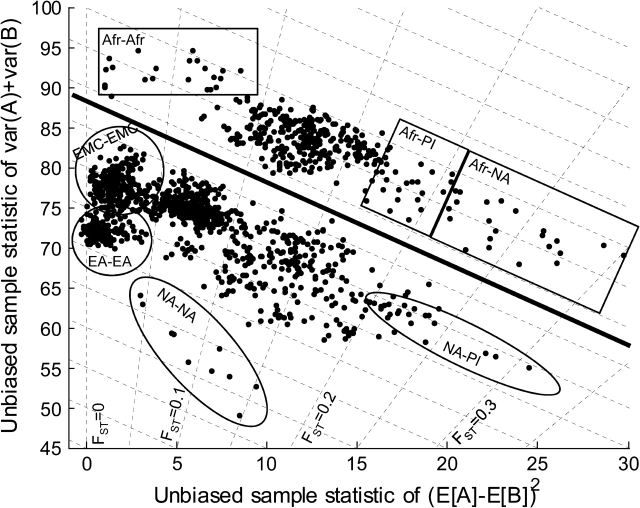
FIG. 4.—
A unifying view of ASD and microsatellite FST. The horizontal axis is interpopulation variance. The vertical axis is intrapopulation variance. Afr = Africans, NA = Native Americans, PI = Pacific Islanders, EA = East Asians, EMC = Europeans, Middle Easterners, and Central South Asians. It is shown (Materials and Methods) that microsatellite FST and ASD are functions of these two variances. Lines of constant ASD are dashed lines with negative slope. Lines of constant FST are dashed lines with positive slope. The data are (53 choose 2) = 1,378 pairwise HGDP population comparisons. Clearly, this picture segregates populations into distinguishable clusters. Africans versus all are above the thick black line. Non-Africans versus non-Africans are below the line. Distinguishable clusters are demarcated in ovals and squares.

