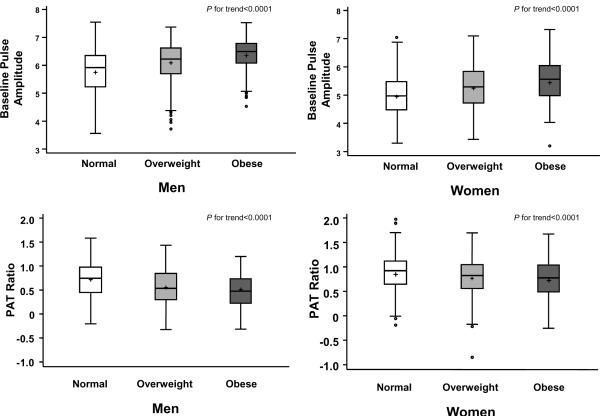
Figure 4.
Boxplot of age-adjusted baseline and hyperemic pulse amplitude according to body mass index category and sex (Normal, <25 kg/m2; Overweight, 25 to <30 kg/m2; Obese ≥30 kg/m2). For men n=283, 471, 249 and for women n=501, 253, 200 for normal, overweight and obese, respectively, P for trend <0.0001.

