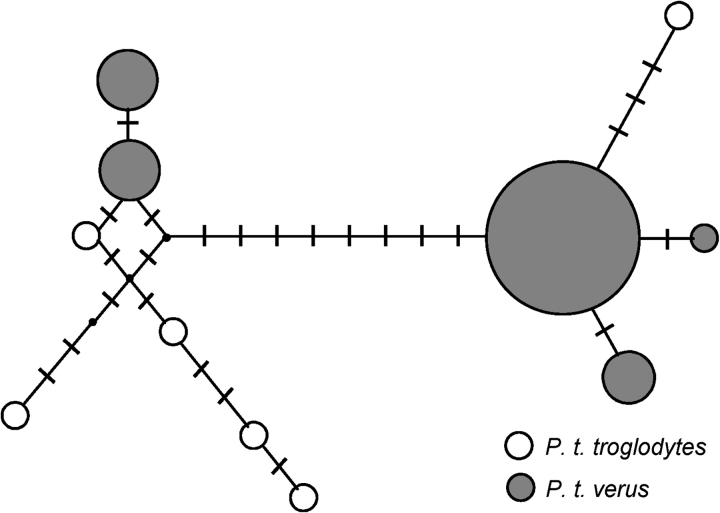
FIG. 2.—
Haplotype network showing the two divergent haplogroups shared between P.t. verus and P.t. troglodytes. Each circle represents a different haplotype and its size is proportional to its frequency in the sample. Mutations distinguishing haplotypes are shown as marks along the lines, whereas missing haplotypes are shown as black dots.

