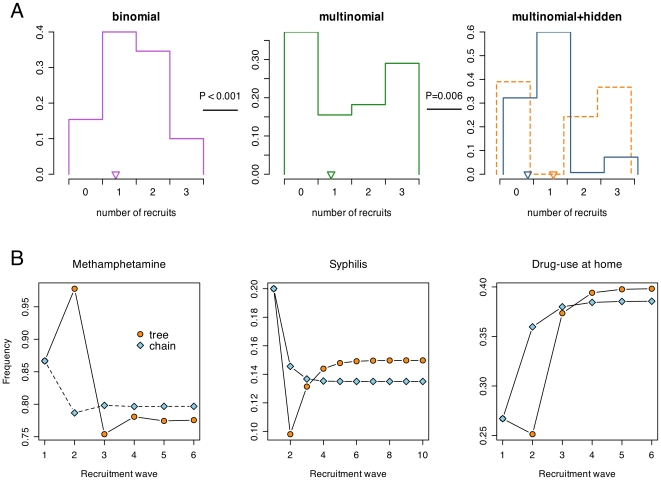
Figure 3. Contrasting model predictions of variation in recruitment dynamics.
( A) Histograms depict the inferred probability distribution for the number of recruits per respondent under the corresponding model. The dotted line histogram indicates the distribution in recruitment ability for respondents in the same hidden state as seed individuals. The mean number of recruits per respondent is indicated for each distribution by an inverted triangle along the x-axis. Plots are separated by P-values obtained from likelihood ratio tests between adjacent models (always favoring the right-hand side). ( B) Contrasting projected composition of samples based on Markov chain and multitype branching process (tree) models of RDS, in which the latter included hidden states to model variation among respondents not explained by the corresponding visible attribute (viz., reporting prior use of methamphetamine, syphilis serostatus, and reporting injection drug use at home in the past six months). Frequencies correspond to the proportion of respondents in the ‘positive’ visible state (i.e., using methamphetamines, syphilis seropositive, or using drugs at home).

