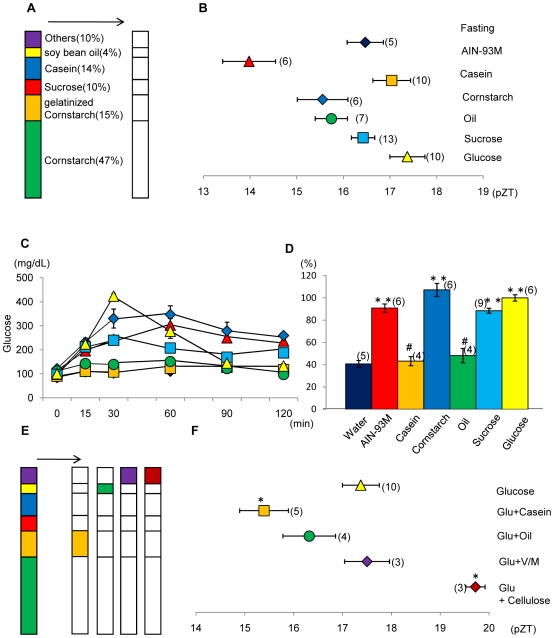
Figure 2. Effects of complete substitution by single nutrient components in the AIN-93M diet on the phase of the liver circadian clock and relative blood glucose value.
A: Percent component of each nutrient in AIN-93M. Other contents were 3.5% AIN-93 mineral mixture, 1% AIN-93 vitamin mixture, 0.25% choline bitartrate, and 0.0008% tert-butyl hydroquinone. Substituted components are shown by the white column segments. B: Mice were administered a diet tablet containing 0.6 g/10 g BW of each nutrient on the first day and 0.85 g/10 g BW of each nutrient on the second day after 24-h food deprivation. Some mice were administered 0.3 mL of soybean oil on the first day and 0.43 mL of soybean oil on the second day after 24-h food deprivation. The values indicate the mean±SEM. The horizontal axis indicates the pZT at the peak of the bioluminescence rhythm. Fisher's PLSD test. *P<0.05 (vs. fasting); fasting, 2-day fast # P<0.05, ## P<0.01 (vs. AIN-93M). C: Time course of the blood glucose level after oral injection of 0.03 g/10 g BW of AIN-93M, 100% cornstarch, 100% casein, 100% sucrose, or 100% glucose or 0.015 mL/10 g BW of 100% soybean oil. For the control, 0.33 mL/10 g BW of water was administered. The vertical axis indicates the content of glucose (mg/dL). Symbol color of each treatment is same as column color in part D. D: Relative blood glucose value (% of blood glucose level produced by 100% glucose) of each nutrient group. This value was calculated by the following formula: 100× [AUC (area under the blood glucose concentration-time curve) during 2 h after each nutrient administration/AUC during 2 h after 100% glucose administration]. The values indicate the mean±SEM. Fisher's PLSD test. **P<0.01 (vs. water). # P<0.05 (vs. AIN-93M). The numbers in the parentheses indicate the number of tested mice. E: Percent component of each nutrient in AIN-93M. Substituted components are shown by the white column. F: Effect of combination of 100% glucose, 86% glucose +14% casein, 96% glucose +4% soybean oil, 95% glucose +5% cellulose, or 95.5% glucose +3.5% AIN-93 mineral mixture and 1% AIN-93 vitamin mixture on the liver circadian clock. Feeding schedule was the same as in Fig. 2B. The values indicate the mean±SEM. The horizontal axis indicates the pZT at the peak of the bioluminescence rhythm. Fisher's PLSD test. *P<0.05 (vs. 100% glucose). # P<0.05 (vs. AIN-93M). The numbers in parentheses indicate the number of tested mice. We used the same data of fasting and AIN-93M as mentioned in Fig. 1 to produce Fig. 2.

