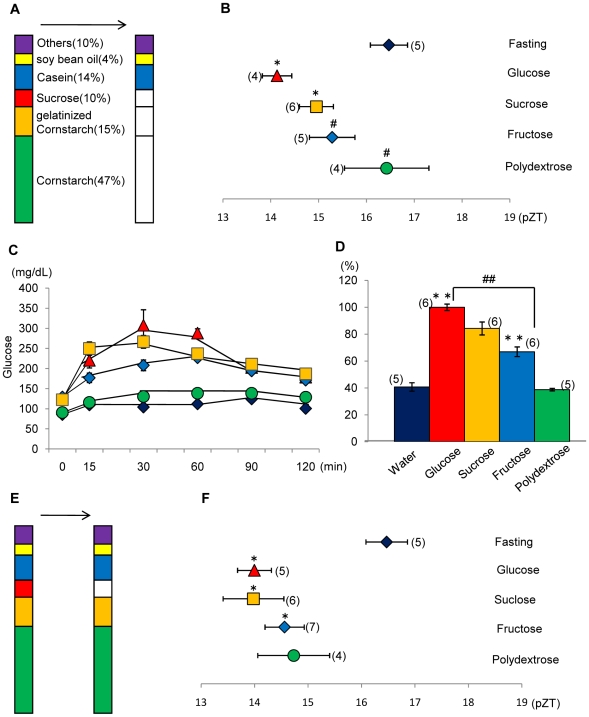
Figure 3. Effects of partial substitution by starch/sugar in the AIN-93M diet on the phase of the liver circadian clock and relative blood glucose value.
A: Percent of each nutrient component in AIN-93M. The ‘other’ category comprised 3.5% AIN-93 mineral mixture, 1% AIN-93 vitamin mixture, 0.25% choline bitartrate, and 0.0008% tert-butyl hydroquinone. Substituted components are shown by the white column segments. B: Mice were administered a diet tablet containing 0.6 g/10 g BW of the substitute diet on the first day and 0.85 g/10 g BW of the substitute diet on the second day after 24-h food deprivation. Nutrient components of cornstarch, gelatinized cornstarch, and sucrose were replaced with glucose, sucrose, fructose, or polydextrose. The horizontal axis indicates the pZT at the peak of the bioluminescence rhythm. Fisher's PLSD test. *P<0.05 (vs. fasting). # P<0.05 (vs. glucose). C: Time course of the blood glucose level after oral injection of 0.03 g/10 g BW of each substituted nutrient. The vertical axis indicates the content of glucose (mg/dL). The values indicate the mean±SEM. Symbol color of each treatment is the same as column color in part D. D: Relative blood glucose value (% of glucose) of nutrient substituted group. Fisher's PLSD test. **P<0.01(vs. water). #P<0.05, ##P<0.01(vs. glucose). E: Percent component of each nutrient in AIN-93M. Substituted components are shown by white column. F: The component of 10% sucrose was substituted with 10% glucose, 10% fructose, or 10% polydextrose. The horizontal axis indicates the pZT at the peak of the bioluminescence rhythm. Fisher's PLSD test. *P<0.05 (vs. fasting). The numbers in parentheses indicate the number of tested mice. We used the same data for fasting and AIN-93M as mentioned in Fig. 1 to produce Fig. 3.

