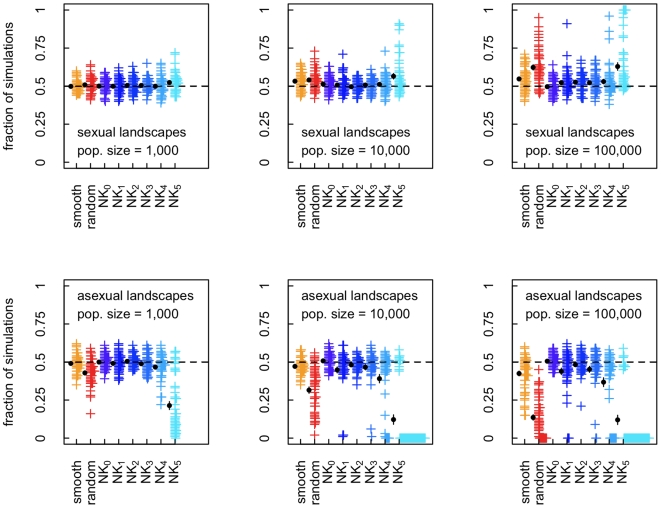
Figure 3. Fraction of simulations in which sex evolved on different types of landscapes for finite population sizes.
For each population size and each landscape we performed 100 simulations. Each cross mark (+) represents the results for one particular landscape, offset horizontally for visibility, calculated as the fraction of those 100 simulations in which sex increased in frequency for a given landscape. The top and bottom row of panels corresponds to landscapes that select for sex versus asex in deterministic simulations. For each landscape type, mean and one standard error of the mean are shown on the left side of the cross marks. In some cases, the standard error is too small to be visible on the plot and is covered by the circle marking the mean value.

