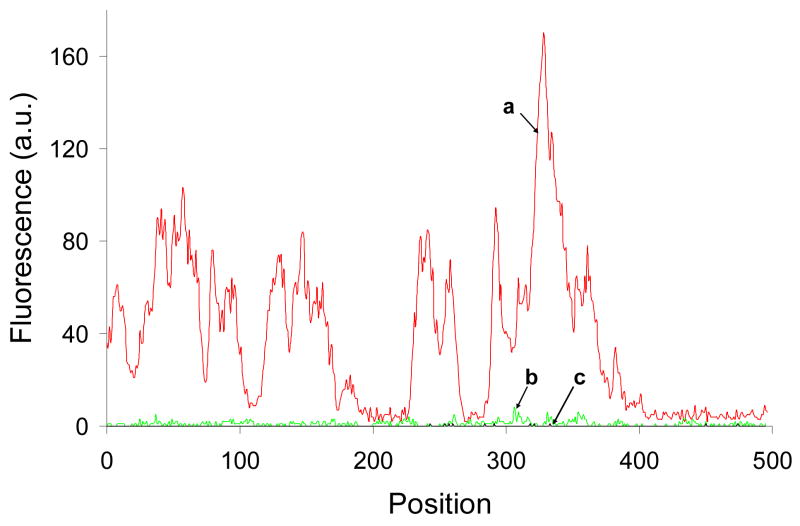
Figure 5.
Comparison of the fluorescence emission signals. (a) The fluorescence intensities due to the immunoassay measured at the cross-section of the glass slide with fractal-like structures shown in Figure 4a as a white line. (b) The fluorescence intensities due to the immunoassay measured at the cross-section of the clean glass slide shown in Figure 4c as a white line. (c) The fluorescence intensities due to non-specific binding measured at the cross-section of the glass slide with fractals shown in Figure 4e as a white line.

