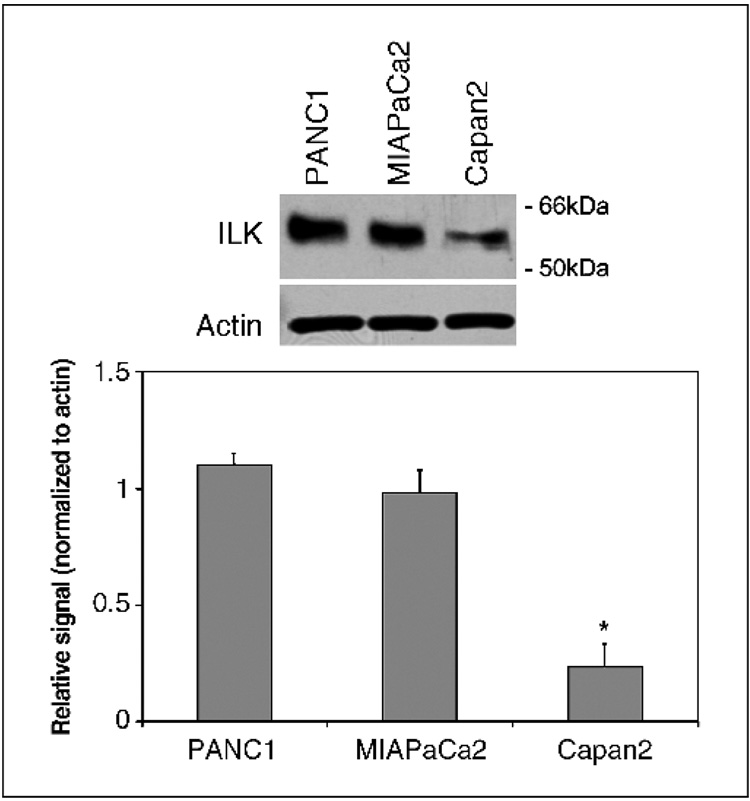
Fig. 1.
ILK expression among the pancreatic adenocarcinoma cell lines PANC1, MIAPaCa2, and Capan2 was quantified by Western blot analysis. PANC1 and MIAPaCa2, which have the greatest degree of gemcitabine chemoresistance (20), exhibited higher levels of ILK expression than Capan2. Representative example with mean densitometric values from triplicate blots.*, P < 0.05 versus Capan2 cells.

