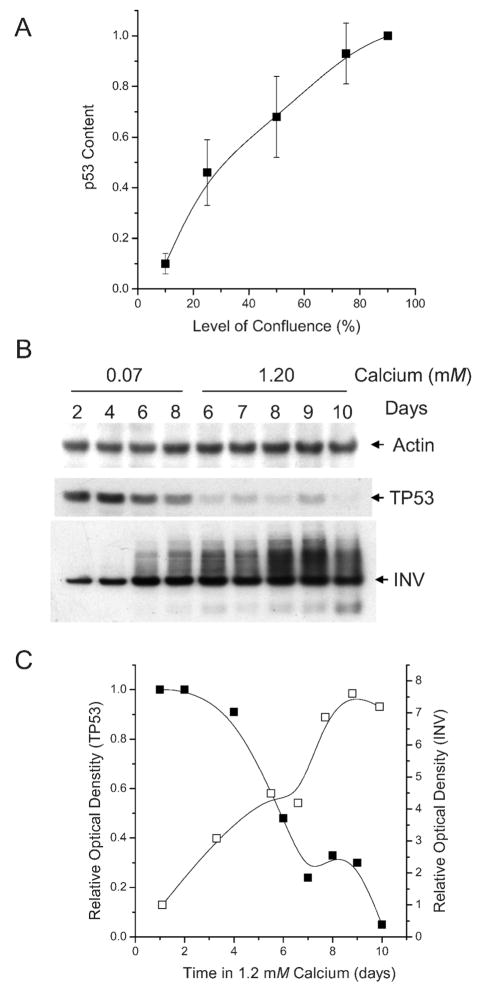
FIG. 1.
Variation in p53 protein expression during keratinocyte differentiation. Panel A: Primary keratinocytes were plated at approximately 10% confluence and collected by trypsinization after they had reached 10, 25, 50, 75 and 90% confluence. Plotted is the fraction of p53 (p53 signal measured by Western blot analysis at various levels of confluence over the p53 signal measured in 90–100% confluent cells; set at 1.0). Panel B: Expression of actin (internal standard), TP53 and involucrin (a differentiated keratinocytes protein) in confluent keratinocytes as a function of time (as indicated) in 0.07 mM or 1.2 mM calcium. Panel C: Graphic comparison of changes in the TP53 (filled squares; plotted as a fraction of the level expressed at day 1) or involucrin (open squares; plotted as the increased expression relative to the level on day 1), both normalized for actin expression, with increasing days of culture in 1.2 mM calcium. In Panel B, the total involucrin signal both in the main involucrin band and in the “smear” of crosslinked involucrin protein was included in the calculation of the increase in involucrin.

